
Control Rig Dependency Navigator
Control Rig Dependency Navigator
Section titled “Control Rig Dependency Navigator”Module: Animation · Category: ControlRig · Tool ID:
ControlRigDependencyNavigator
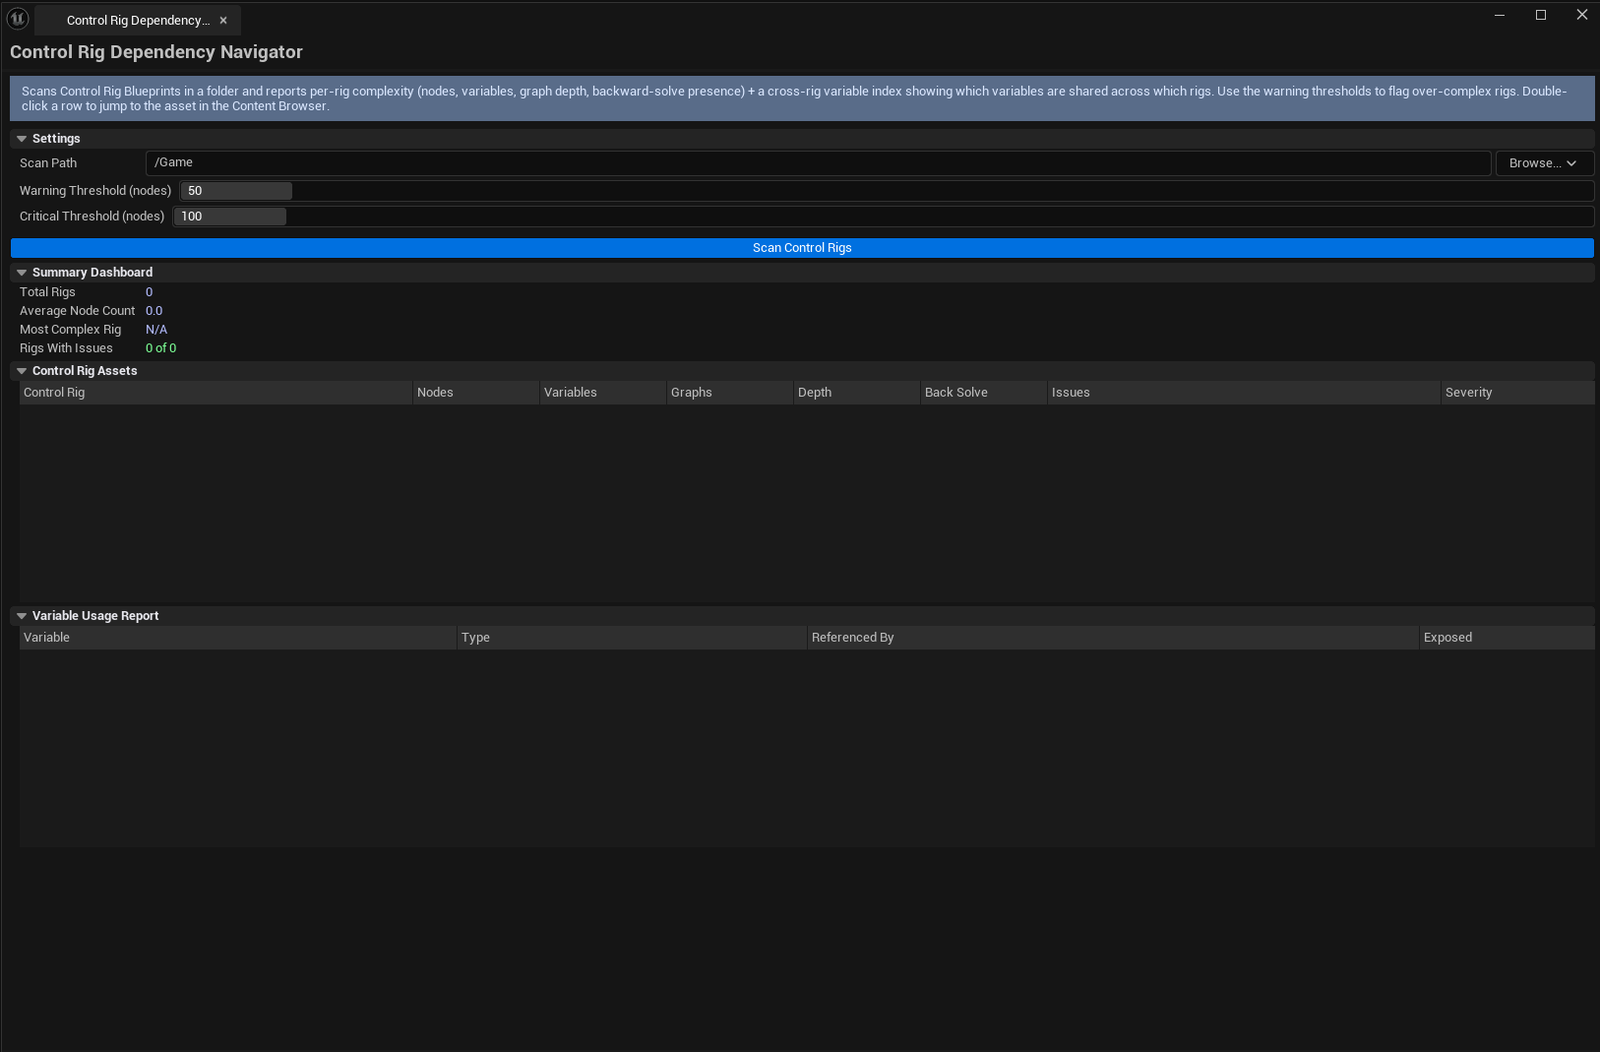
The deeper sibling of Control Rig Inspector. Beyond top-level node counts, this tool analyzes graph depth, backward-solve usage, and cross-rig variable references — built entirely via reflection so it doesn’t pull in the Control Rig module as a dependency. Includes a summary dashboard with aggregate stats and per-rig drill-in.
When to use it
Section titled “When to use it”- Investigating “why is this rig slow?” beyond just node count
- Refactoring a rig and wanting to see which AnimBPs / other rigs reference its variables
- Auditing a project’s full rig stack — the summary dashboard gives a one-glance picture
- Pre-merge review when a teammate has updated a shared Control Rig
When not to use it
Section titled “When not to use it”- Don’t use this for the quick “what rigs do I have?” check — Control Rig Inspector is faster for that
- Don’t expect graph rendering — it inspects via reflection, doesn’t render the rig graph itself
Opening the tool
Section titled “Opening the tool”- Open the EQLabs Hub and search for
Control Rig Dependency(or browse to Animation → ControlRig) - Click the tool card
- Click Scan Rigs to walk every Control Rig asset in the project
Interface tour
Section titled “Interface tour”| Section | What it does |
|---|---|
| Scan Path | Folder to recursively scan. Default /Game. |
| Warning Threshold | Node count for Warning severity. Default 50. |
| Critical Threshold | Node count for Critical severity. Default 100. |
| Scan Rigs button | Walks every Control Rig Blueprint via reflection |
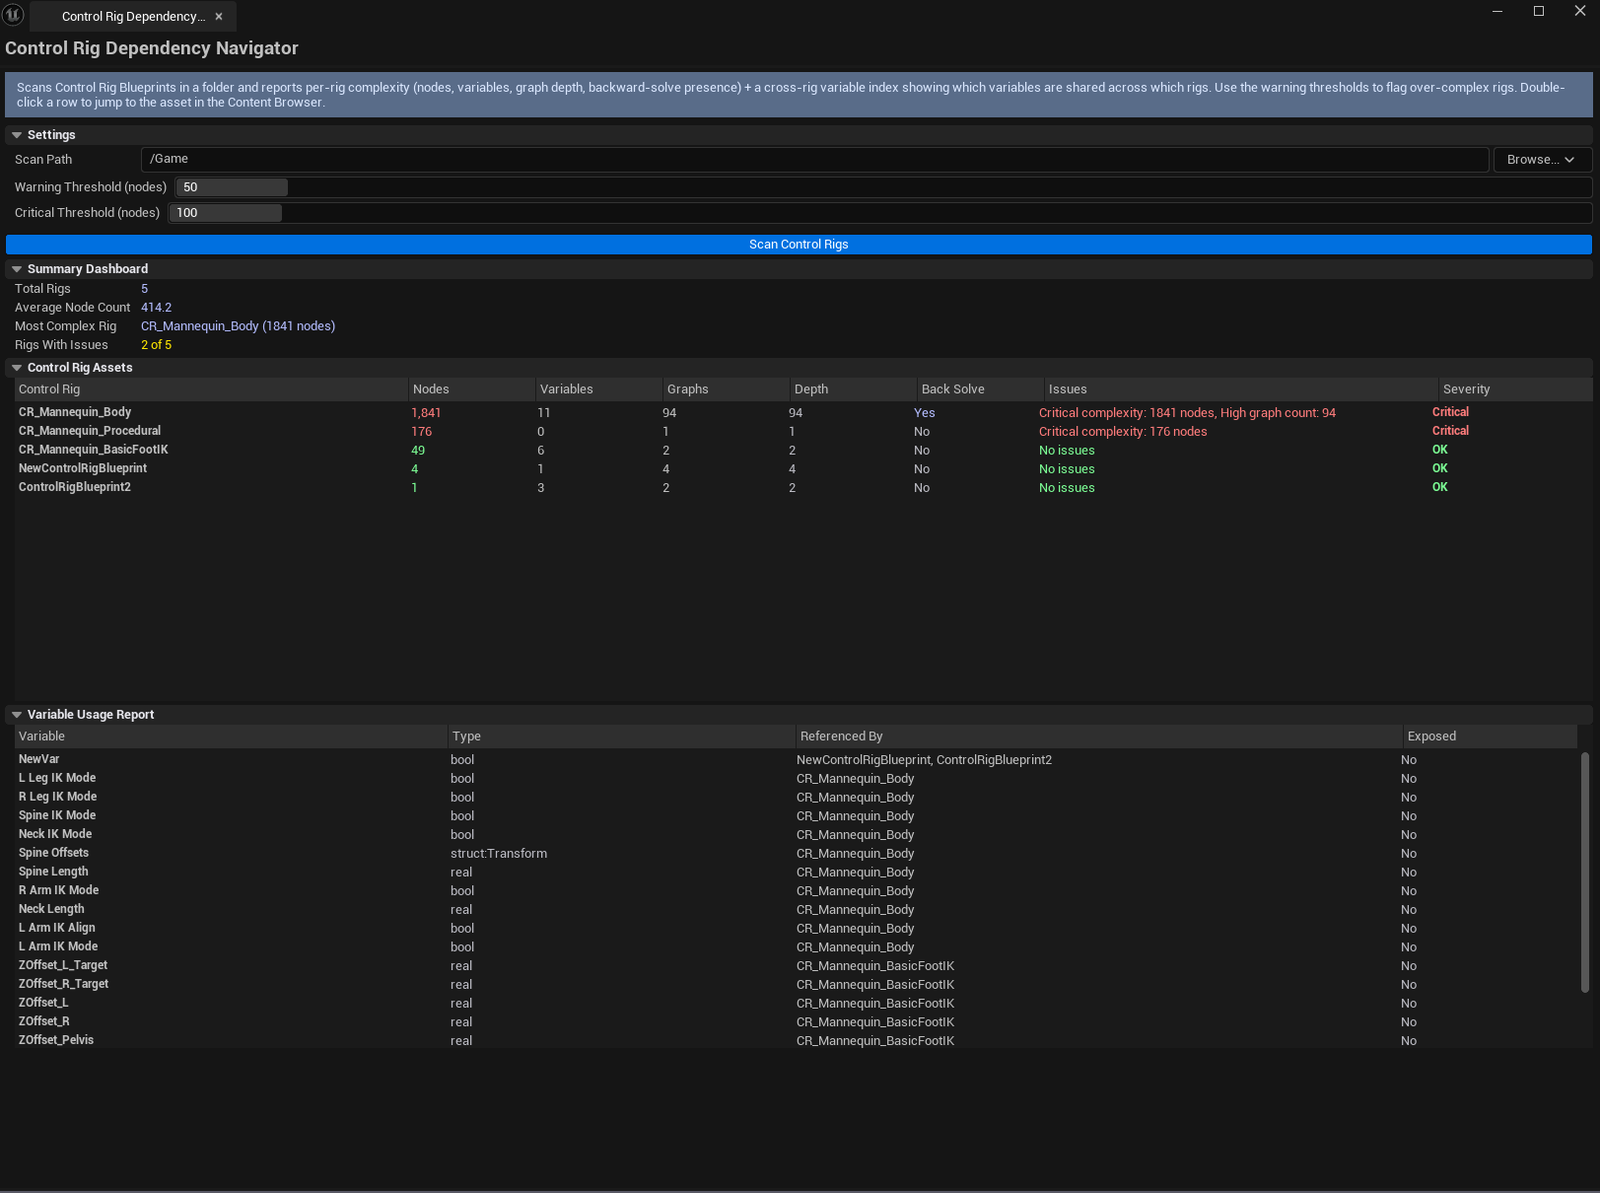
| Summary dashboard | Total rigs, average nodes, most-complex rig name, total issue count |
| Rigs list (sortable) | Per-rig row: name, node count, variable count, graph count, estimated depth, backward-solve flag, severity, issues |
| Variables list | Per-variable row: name, type, list of rigs that reference it, exposed-to-AnimBP flag |
Summary dashboard fields
Section titled “Summary dashboard fields”| Field | What it shows |
|---|---|
| Total Rigs | Count of Control Rig assets found under the scan path |
| Average Nodes | Mean node count across all rigs |
| Most Complex | Name of the rig with the highest node count |
| Issue Count | Total Warning + Critical entries |
Severity coding
Section titled “Severity coding”| Severity | Meaning |
|---|---|
| OK | Below Warning Threshold, no other issues |
| Warning | Crossed Warning Threshold, or has unusual configurations (e.g., backward-solve enabled with high node count) |
| Critical | Crossed Critical Threshold, or multiple severe issues |
Workflow
Section titled “Workflow”Step 1 — Configure thresholds
Section titled “Step 1 — Configure thresholds”Defaults (Warning: 50, Critical: 100) suit most projects. Tighten for performance-critical (mobile / VR) projects, loosen for AAA character work.
Step 2 — Scan
Section titled “Step 2 — Scan”Click Scan Rigs. The summary dashboard, rigs list, and variables list all populate.
Step 3 — Walk the dashboard first
Section titled “Step 3 — Walk the dashboard first”The Most Complex rig is your usual top investigation target. Issue Count tells you how big the cleanup effort is.
Step 4 — Drill into rigs
Section titled “Step 4 — Drill into rigs”Click a rig in the rigs list to filter the Variables list to just the variables that rig uses. This is the cross-reference workflow — see at a glance which variables are shared and which are local.
Step 5 — Inspect variables
Section titled “Step 5 — Inspect variables”The Variables list shows you, per variable, which rigs reference it. A variable used by 5+ rigs is shared infrastructure; deleting or renaming it has wider impact than it looks.
Settings reference
Section titled “Settings reference”| Field | What it does | Default |
|---|---|---|
| Scan Path | Folder to recursively scan | /Game |
| Warning Threshold | Node count for Warning severity | 50 |
| Critical Threshold | Node count for Critical severity | 100 |
Settings are persisted to
[Project]/Saved/EQLabs/Settings/ControlRigDependencyNavigator.json.
Output
Section titled “Output”- In-panel results — summary, rigs list, variables list (cleared on each rescan)
- No edits — read-only analysis
Tips & gotchas
Section titled “Tips & gotchas”- Reflection-only inspection means no Control Rig module dependency — counts are accurate but the Navigator doesn’t render the actual graph; for that, double-click a rig to open it in the Control Rig editor.
- “Estimated graph depth” is heuristic — it’s a best-effort estimate via reflection, not a precise traversal of the execution path.
- A backward-solve flag isn’t bad on its own — but combined with high node count, it usually signals a rig doing too many things. Worth a refactor look.
- Variables exposed to AnimBP are a contract — renaming or removing them breaks downstream AnimBPs. The variables list flags which variables fall in this category.
- Sortable column headers — click any column to sort. Default sort is by node count, descending.
Related tools
Section titled “Related tools”- Control Rig Inspector — quick top-level pass; this Navigator is the deeper drill-in
- Skeleton Inspector & Rig Shortcuts — analyze the underlying skeleton
Opens our feedback form in a new tab with the tool name pre-filled.