
Project Health Dashboard
Project Health Dashboard
Section titled “Project Health Dashboard”Module: Core · Category: Release · Tool ID:
ProjectHealthDashboard
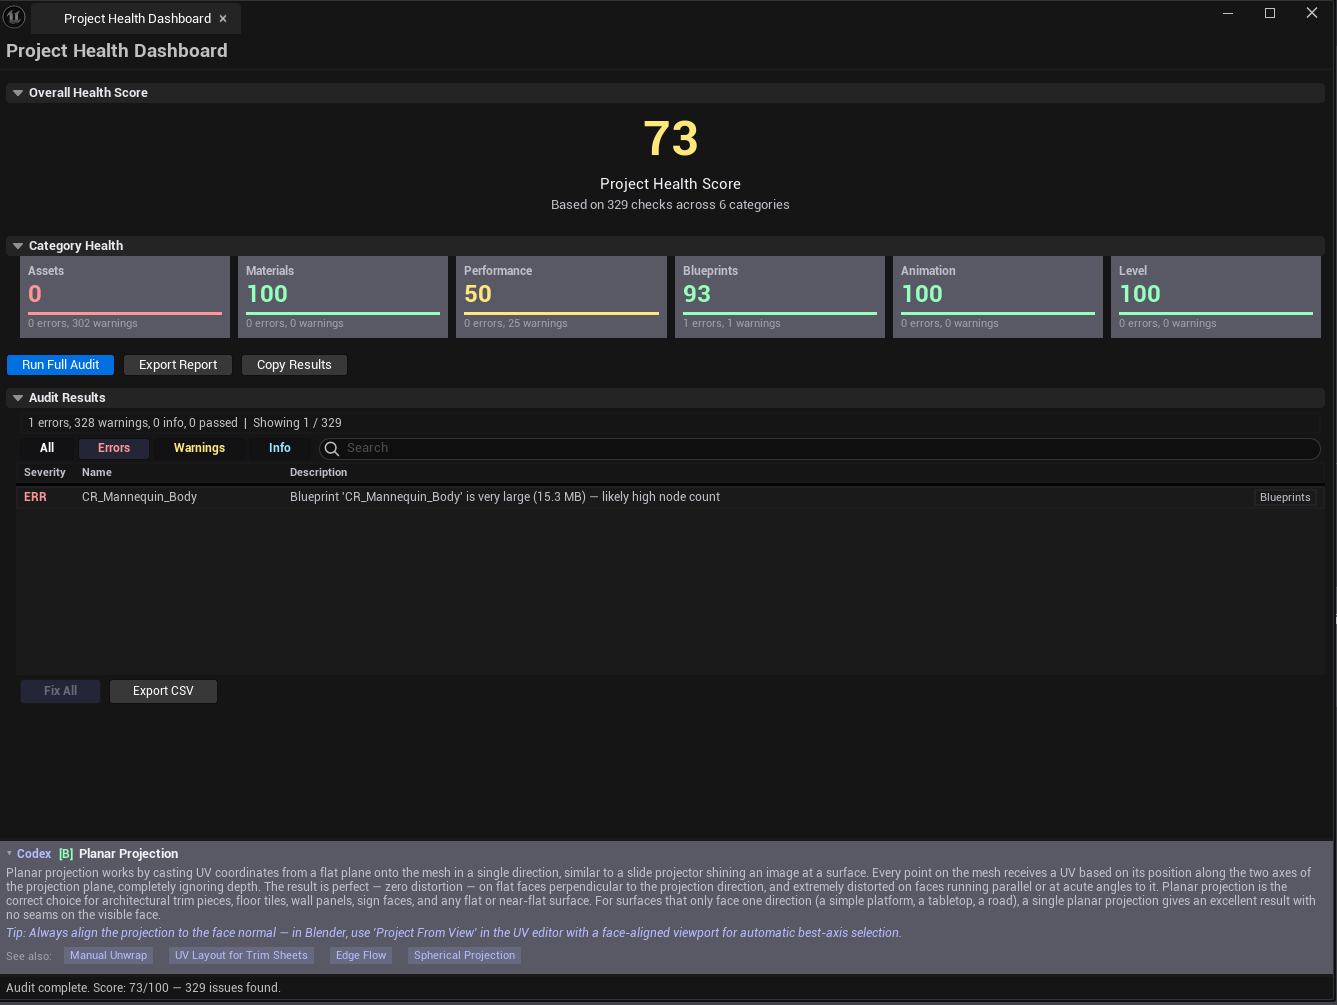
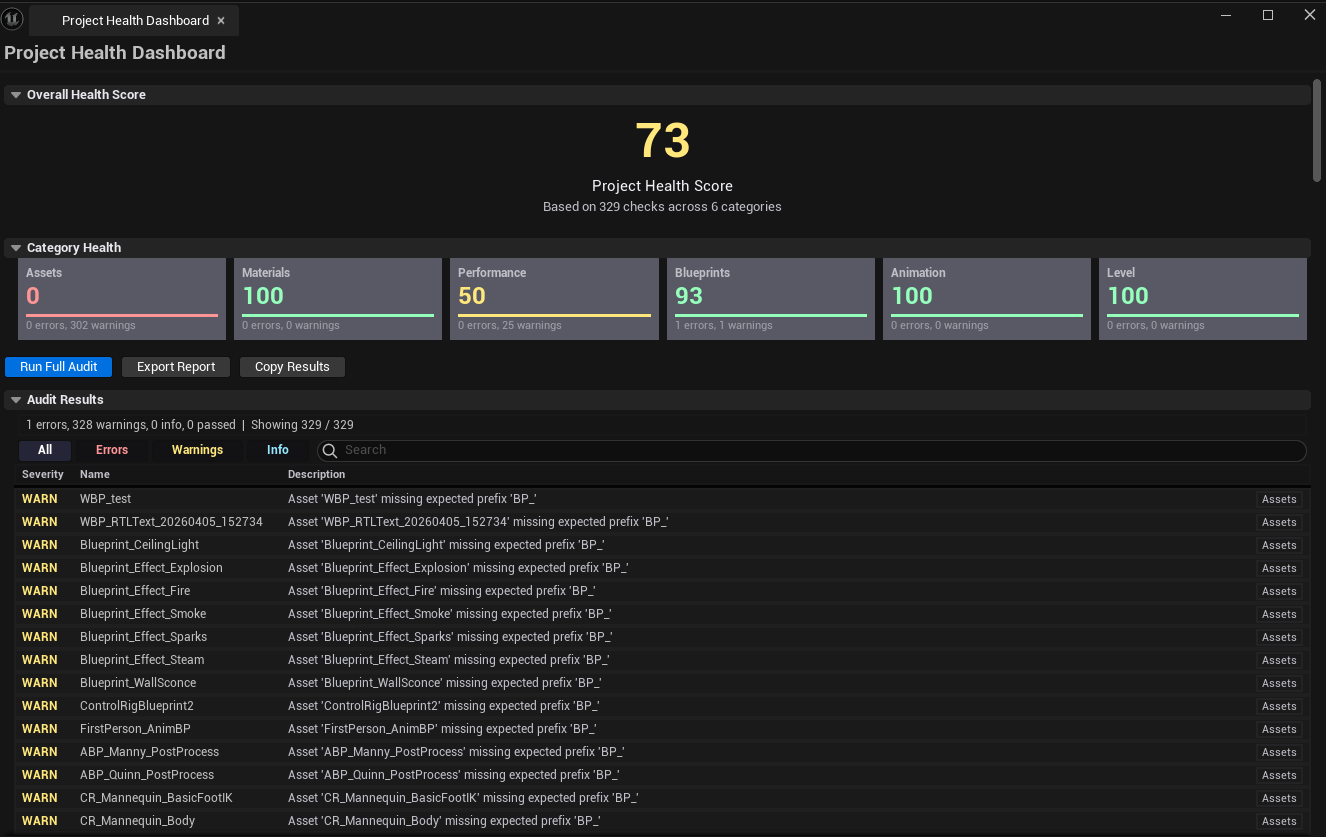
The first tool you should run on any project. Aggregates lightweight asset-registry checks across six categories (Assets, Materials, Performance, Blueprints, Animation, Level) into one score and a categorized result list. Per-category color-coded scorecards make health-status obvious at a glance. Click any result to navigate; export the audit as a report.
When to use it
Section titled “When to use it”- First run on any new or inherited project — gives the 30-second health overview
- Pre-milestone audit — confirming nothing critical regressed
- Pre-shipping sweep — high-level pass before the deeper Project Doctor Suite audit
- Onboarding new team members — they can see project state without running 100 individual tools
When not to use it
Section titled “When not to use it”- Don’t expect deep per-tool insights — this is the summary. For detail, drill into specific tools per category
- Don’t expect runtime / packaging audit — see Ship Lab for build / release
Opening the tool
Section titled “Opening the tool”- Open the EQLabs Hub — the Project Health Dashboard is the first card in the Release category
- Click the tool card
- Click Run Full Audit
Interface tour
Section titled “Interface tour”| Section | What it does |
|---|---|
| Run Full Audit | Executes all six category checks |
| Export Report | Saves the audit as a report file |
| Copy Results | Plain-text dump |
| Overall Score | Aggregate 0–100 health score |
| Summary Label | Total checks run + result counts |
| Category cards (6) | Per-category color-coded score with error/warning counts |
| Results list | Per-issue row using FEQLabsResultItem — click to navigate |
Categories
Section titled “Categories”| Category | What it covers |
|---|---|
| Assets | Naming conventions, orphans, basic asset hygiene |
| Materials | Complexity, master/instance health |
| Performance | Texture sizes, draw call estimates, foliage density |
| Blueprints | Complexity, tick usage, deprecated nodes |
| Animation | AnimSequence / AnimBP basic checks |
| Level | Level lighting, world partition, replication setup |
Score color coding
Section titled “Score color coding”| Score | Color | Meaning |
|---|---|---|
| 90–100 | Green | Healthy |
| 70–89 | Yellow | Some issues |
| 50–69 | Orange | Multiple issues |
| < 50 | Red | Critical attention needed |
Workflow
Section titled “Workflow”- Click Run Full Audit
- Read the Overall Score + per-category cards
- Walk the Results list — single-click pings the asset/actor; double-click opens it
- For each Critical category, drill into the relevant module’s tools (e.g., low Materials score → Material Profiler, Material Layer Studio)
- Re-run after fixes to confirm score recovery
- Optionally Export Report for milestone documentation
Settings reference
Section titled “Settings reference”No persisted settings beyond the standard tool framework.
Settings file:
[Project]/Saved/EQLabs/Settings/ProjectHealthDashboard.json
Output
Section titled “Output”- In-panel score + categories + results list
- Report export — full audit as a file
- Clipboard — Copy Results
- No edits — read-only audit (for fixes, drill into specific module tools)
Tips & gotchas
Section titled “Tips & gotchas”- Lightweight by design — uses
FAssetDataand tag queries to avoid loading full assets. Runs fast even on large projects. - Use as a signal, not the whole audit — the score is aggregate; for actionable detail, use the tool the category points to
- Score doesn’t equal shippability — a 90+ score is great, but specific subsystem checks (Quest Readiness, Project Doctor) are still required before ship
Related tools
Section titled “Related tools”- Project Doctor — flagship 5-tab pre-shipping audit (deep dive)
- Ship Lab — build / packaging / release pipeline
- Quest Readiness Scanner — XR-specific readiness
Report an issue with this tool
Opens our feedback form in a new tab with the tool name pre-filled.