
Shader Diagnostics Suite
Shader Diagnostics Suite
Section titled “Shader Diagnostics Suite”Module: Tech · Category: Debugging · Tool ID:
ShaderDiagnosticsSuite
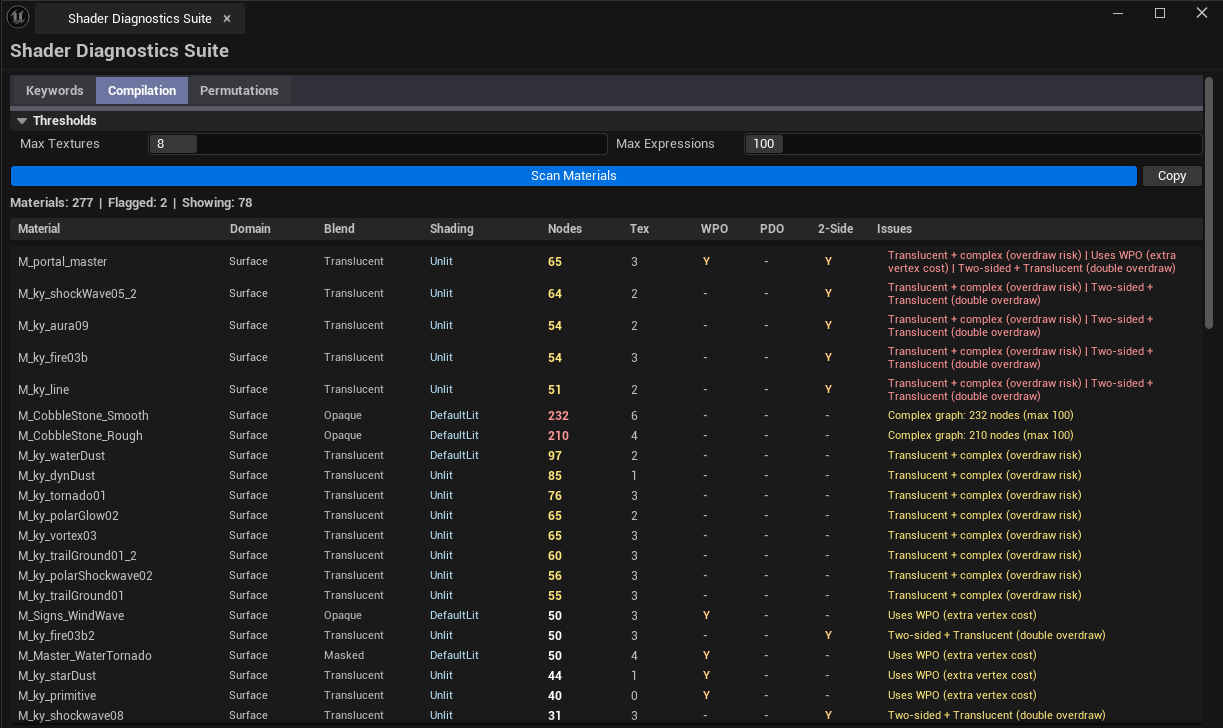
Three-tab shader debugging suite. Keywords inspects parameters and static switches per material. Compilation monitors instruction counts and complexity flags. Permutations analyzes shader permutation bloat — the number of compiled variants per material.
When to use it
Section titled “When to use it”- Shader compile time exploding — find the materials with thousands of permutations
- Material complexity audit — instruction count per material
- Static-switch debugging — finding which switches are actually doing work
When not to use it
Section titled “When not to use it”- Don’t expect this to auto-fix permutation bloat — surfaces the problem; fixes are per-material
Opening the tool
Section titled “Opening the tool”- Open the EQLabs Hub and search for
Shader(or browse to Tech → Debugging) - Click the tool card
- Use the tab bar: Keywords / Compilation / Permutations
Tab 1 — Shader Keyword Debugger
Section titled “Tab 1 — Shader Keyword Debugger”Inspects per-material parameters and static switches.
Tab 2 — Shader Compilation Monitor
Section titled “Tab 2 — Shader Compilation Monitor”Per-material instruction counts, complexity flags, sampler counts.
Tab 3 — Shader Permutation Analyzer
Section titled “Tab 3 — Shader Permutation Analyzer”Permutation bloat detection — how many variants of a shader exist due to static switches × feature flags × platform variants.
Settings reference
Section titled “Settings reference”Persists via standard tool framework.
Output
Section titled “Output”- In-panel results per tab
- No edits — read-only
Tips & gotchas
Section titled “Tips & gotchas”- Permutation bloat is a known UE5 pain point — materials with many static switches generate exponential variants
- Single-click pings; double-click opens the Material editor
Related tools
Section titled “Related tools”- Material Profiler — complementary material complexity / QA analysis
- Rendering Systems Auditor — runtime rendering performance side
Report an issue with this tool
Opens our feedback form in a new tab with the tool name pre-filled.