
Niagara Profiler
Niagara Profiler
Section titled “Niagara Profiler”Module: Art · Category: VFX · Tool ID:
VFXComplexityAnalyzer
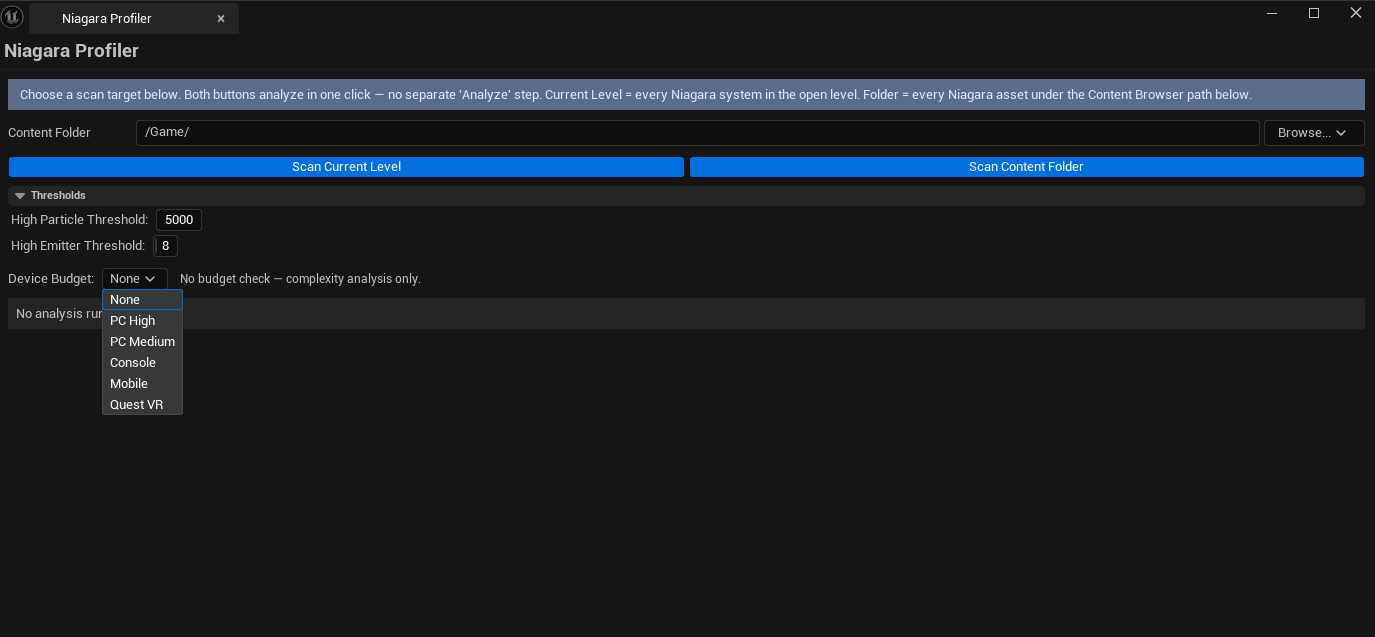
A project-wide Niagara analyzer that profiles every particle system for emitter count, max particles, GPU/CPU sim mode, overdraw cost, material complexity, ribbon/mesh/light renderer overhead, and collision/event usage. Includes per-device-profile budget compliance checks (PC High, PC Medium, Console, Mobile, Quest VR).
When to use it
Section titled “When to use it”- Performance budget pass — find every Niagara system that’s over your platform’s particle/emitter cap
- Multi-platform shipping — confirm mobile / Quest VR builds won’t blow up because of a single hero VFX
- Optimization sweep — identify which systems lean on expensive features (light renderers, collision, events)
- Onboarding to a project — get an objective view of the VFX budget across all systems
When not to use it
Section titled “When not to use it”- Don’t use this for runtime VFX debugging — it’s asset-side analysis, not a runtime profiler
- Don’t expect Cascade analysis — Niagara only
Opening the tool
Section titled “Opening the tool”- Open the EQLabs Hub and search for
Niagara(or browse to Art → VFX) - Click the tool card
- Pick a scan mode (Current Level or Content Browser path)
- Optionally pick a device profile to enable budget compliance checking
- Click Run Analysis
Interface tour
Section titled “Interface tour”| Section | What it does | Default |
|---|---|---|
| Scan Mode | Current Level (only NiagaraComponents in the active level) or Content Browser (every NiagaraSystem under a path) | Current Level |
| Scan Path | Folder to scan in Content Browser mode | /Game/ |
| Device Profile | None / PC High / PC Medium / Console / Mobile / Quest VR — when not None, budget compliance is computed | None |
| High Particle Threshold | Particle count above which the system is flagged | 5000 |
| High Emitter Threshold | Emitter count above which the system is flagged | 8 |
| Run Analysis button | Walks the chosen scope, builds reports | |
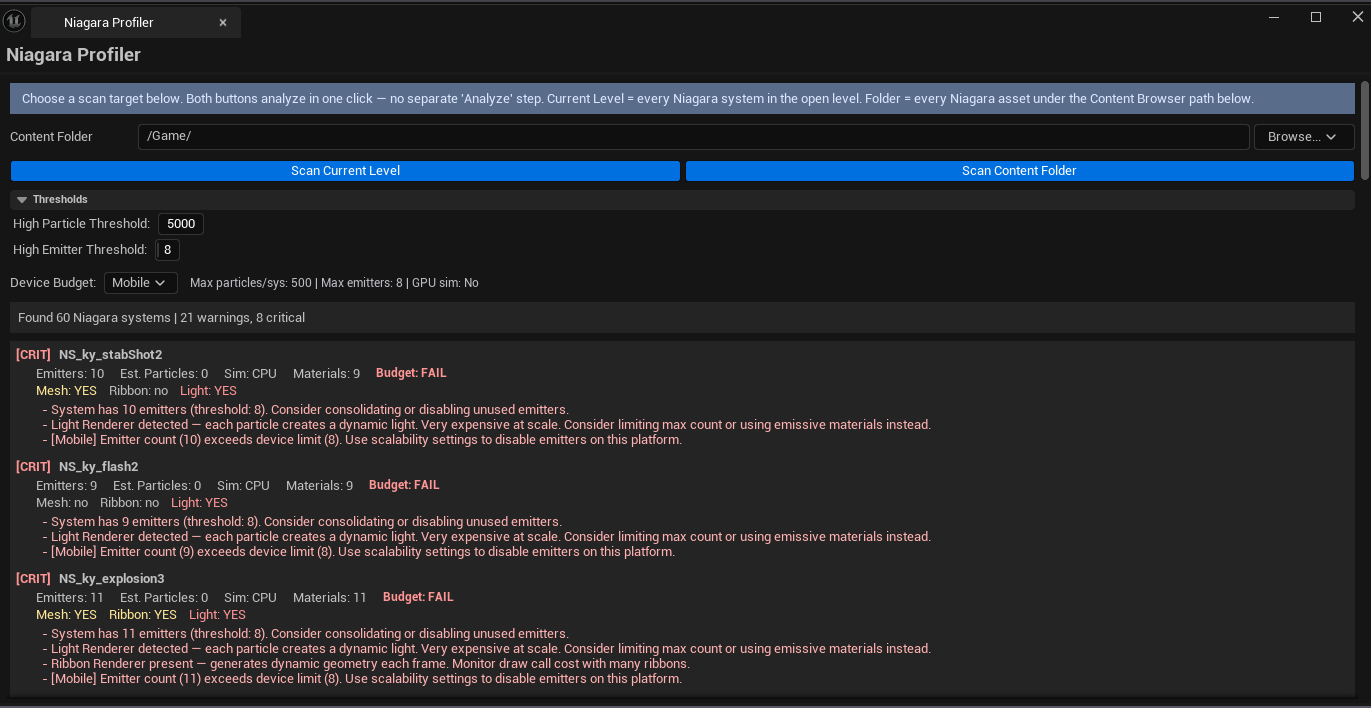
| Summary | Total systems / warnings / criticals | |
| Reports list | Per-system row: name, emitter count, max particles, GPU/CPU flag, collision/event flags, renderer flags, material count, overdraw factor, severity, budget status |
Severity coding
Section titled “Severity coding”| Severity | Meaning |
|---|---|
| Good | Under thresholds, no expensive flags |
| Warning | At least one threshold crossed, or moderately expensive feature combinations |
| Critical | Multiple thresholds crossed, or extreme particle/emitter counts |
Budget compliance (when a device profile is selected)
Section titled “Budget compliance (when a device profile is selected)”| Status | Meaning |
|---|---|
| None | No device profile selected |
| Pass | Within the profile’s particle/emitter budgets and GPU sim is allowed if used |
| Warn | Close to the profile’s limit |
| Fail | Exceeds the profile’s particle / emitter cap, or uses GPU sim when not allowed |
Workflow
Section titled “Workflow”Step 1 — Pick a scope
Section titled “Step 1 — Pick a scope”Current Level is fastest for an in-progress level. Content Browser with a folder is right for project-wide audits.
Step 2 — Pick a device profile
Section titled “Step 2 — Pick a device profile”If you’re targeting only PC High, you can skip the budget step. For multi-platform projects, set the profile to your weakest target (typically Mobile or Quest VR) — that’s where budgets bite first.
Step 3 — Run analysis
Section titled “Step 3 — Run analysis”Click Run Analysis. The list populates. Sort by severity — Critical entries are your top priorities.
Step 4 — Drill into individual systems
Section titled “Step 4 — Drill into individual systems”Single-click pings the NiagaraSystem in the Content Browser. Double-click opens it in the Niagara editor.
Settings reference
Section titled “Settings reference”| Field | What it does | Default |
|---|---|---|
| Scan Mode | Current Level or Content Browser | Current Level |
| Scan Path | Content Browser scan path | /Game/ |
| High Particle Threshold | Severity flag threshold | 5000 |
| High Emitter Threshold | Severity flag threshold | 8 |
| Device Profile | Budget compliance target | None |
Settings are persisted to
[Project]/Saved/EQLabs/Settings/VFXComplexityAnalyzer.json.
Output
Section titled “Output”- In-panel report list — cleared on each rescan
- No edits — read-only analysis
Tips & gotchas
Section titled “Tips & gotchas”- GPU sim is faster than CPU sim — usually — but on mobile / Quest VR, GPU sim isn’t always available. The budget profile flags GPU-using systems on platforms that don’t support it.
- Overdraw factor is an estimate —
Sprite count × particle size / screen areais a heuristic. Use it for relative prioritization, not absolute pixel-fill predictions. - Light renderers are expensive — flagged in the renderer column; one-off use is fine, dozens of light-rendering particle systems will tank performance.
- Material count includes per-emitter materials — high counts mean shader compile and draw call overhead even before particles are drawn.
- Niagara Budget Sentinel was absorbed into this tool (P18) — the device profile section is the absorbed Sentinel functionality.
Related tools
Section titled “Related tools”- Flipbook Maker — for authoring sprite sheets that feed Niagara systems
- Project Doctor Suite (Tech module) — broader project-health analysis including VFX
Opens our feedback form in a new tab with the tool name pre-filled.