
Runtime Insights
Runtime Insights
Section titled “Runtime Insights”Module: Tech · Category: Performance · Tool ID:
RuntimeInsightsSuite
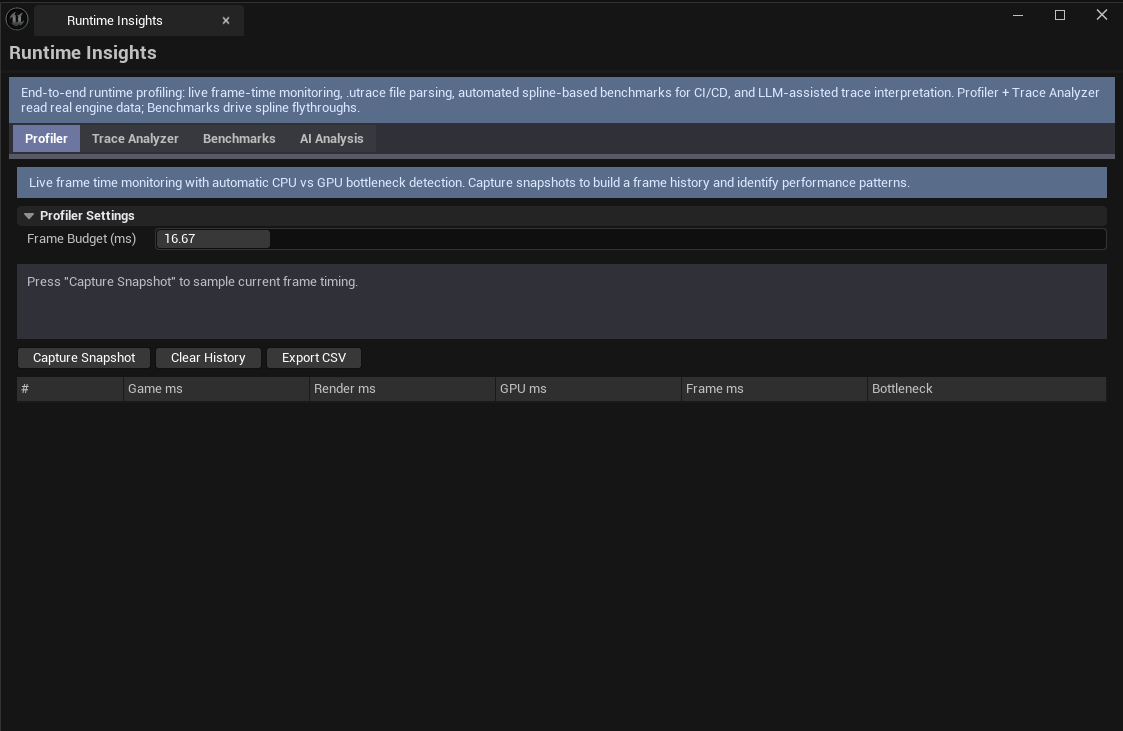
Four-tab end-to-end runtime profiling pipeline. Profiler monitors stat unit live with CPU vs GPU bottleneck classification. Trace Analyzer parses .utrace files with per-thread event breakdown. Benchmarks runs spline-based automated benchmarks with CSV/JSON export for CI/CD regression tracking. AI Analysis does LLM-powered trace interpretation (Coming Soon).
When to use it
Section titled “When to use it”- Runtime performance investigation during PIE / packaged builds
- Trace file analysis — opening
.utracefiles captured during play - CI/CD performance regression tracking — automated benchmark + JSON export
- Bottleneck classification — “is this CPU-bound or GPU-bound?”
When not to use it
Section titled “When not to use it”- Don’t expect asset-side analysis — runtime profiling only
- Don’t expect this to replace Unreal Insights — complementary; UE Insights handles deep traces
Opening the tool
Section titled “Opening the tool”- Open the EQLabs Hub and search for
Runtime Insights(or browse to Tech → Performance) - Click the tool card
- Use the tab bar: Profiler / Trace Analyzer / Benchmarks / AI Analysis
Tab 1 — Profiler
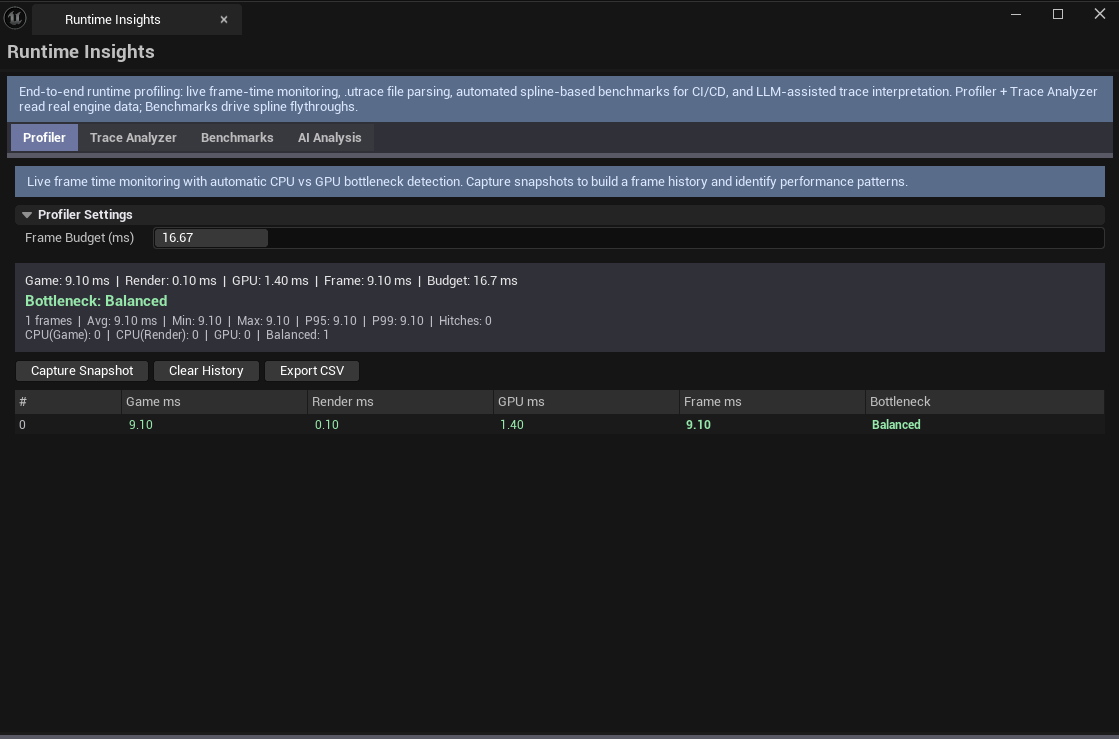
Section titled “Tab 1 — Profiler”Live frame monitoring with stat unit parsing + bottleneck classification (CPU-bound / GPU-bound / Sync-limited).
Tab 2 — Trace Analyzer
Section titled “Tab 2 — Trace Analyzer”Parse .utrace files. Per-thread event breakdown, hot-function detection.
Tab 3 — Benchmarks
Section titled “Tab 3 — Benchmarks”Automated benchmark runner:
- Spline-based camera path
- Capture frame-time per sample point
- CSV/JSON export
- Suitable for CI/CD perf regression detection
Tab 4 — AI Analysis
Section titled “Tab 4 — AI Analysis”Coming Soon — LLM-powered trace interpretation. Feed a trace, get plain-English diagnosis.
Workflow
Section titled “Workflow”Live profile
Section titled “Live profile”- Switch to Profiler
- Start PIE
- Watch frame metrics + bottleneck classification
Trace analysis
Section titled “Trace analysis”- Capture a trace (UE’s Insights or via console
trace.start) - Switch to Trace Analyzer
- Open the
.utracefile - Walk per-thread events
CI benchmark
Section titled “CI benchmark”- Set up a spline path through the level
- Switch to Benchmarks
- Run — captures frame-times along the path
- Export JSON; plug into your CI’s regression-detection pipeline
Settings reference
Section titled “Settings reference”Per-tab settings persist via standard tool framework.
Output
Section titled “Output”- Live in-panel metrics — Profiler tab during PIE
- Trace analysis — read-only display from
.utrace - Benchmark CSV / JSON — for CI/CD pipeline ingestion
Tips & gotchas
Section titled “Tips & gotchas”- Profiler is a
stat unitconsumer — same data UE shows in console, presented with bottleneck classification - Benchmark is reproducible — same spline path = same benchmark, useful for regression detection
- AI Analysis is Coming Soon — V1 leaves the tab as a placeholder with a “coming soon” banner
Related tools
Section titled “Related tools”- Rendering Systems Auditor — pre-runtime rendering audit
- Scene Optimization Advisor — actor/component-level optimization
Opens our feedback form in a new tab with the tool name pre-filled.