
Control Rig Inspector
Control Rig Inspector
Section titled “Control Rig Inspector”Module: Animation · Category: ControlRig · Tool ID:
ControlRigInspector
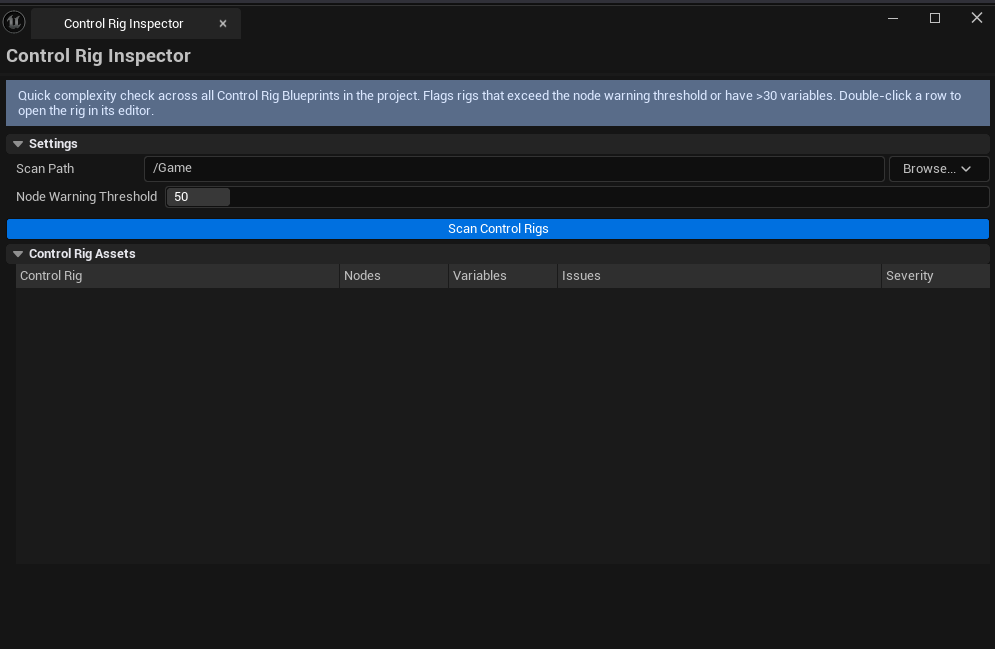
A lightweight roster of every Control Rig asset in the project with node and variable counts. Surfaces rigs that have crossed reasonable complexity thresholds and may need refactoring or splitting. For deeper per-rig analysis (graph depth, backward-solve usage, variable cross-references), use Control Rig Dependency Navigator.
When to use it
Section titled “When to use it”- Quick “what’s the state of my rigs?” check before a complexity discussion
- Finding the heaviest Control Rigs in a project (typical performance sources)
- Pre-merge sanity check on a teammate’s new rig
- After a project import — confirm none of the imported rigs are absurdly complex
When not to use it
Section titled “When not to use it”- Don’t use this for deep rig analysis — it’s a top-level scan; use Control Rig Dependency Navigator for graph depth, variable cross-refs, and backward-solve detection
- Don’t use this to edit rigs — read-only against the source assets
Opening the tool
Section titled “Opening the tool”- Open the EQLabs Hub and search for
Control Rig(or browse to Animation → ControlRig) - Click the Control Rig Inspector card
- Click Scan to walk every Control Rig asset in the project
Interface tour
Section titled “Interface tour”| Section | What it does |
|---|---|
| Scan Path | Folder to recursively scan. Default /Game. |
| Node Warning Threshold | Total node count above which the rig is flagged as Warning. Default 50. |
| Scan button | Walks every Control Rig Blueprint via reflection (no Control Rig module dependency) |
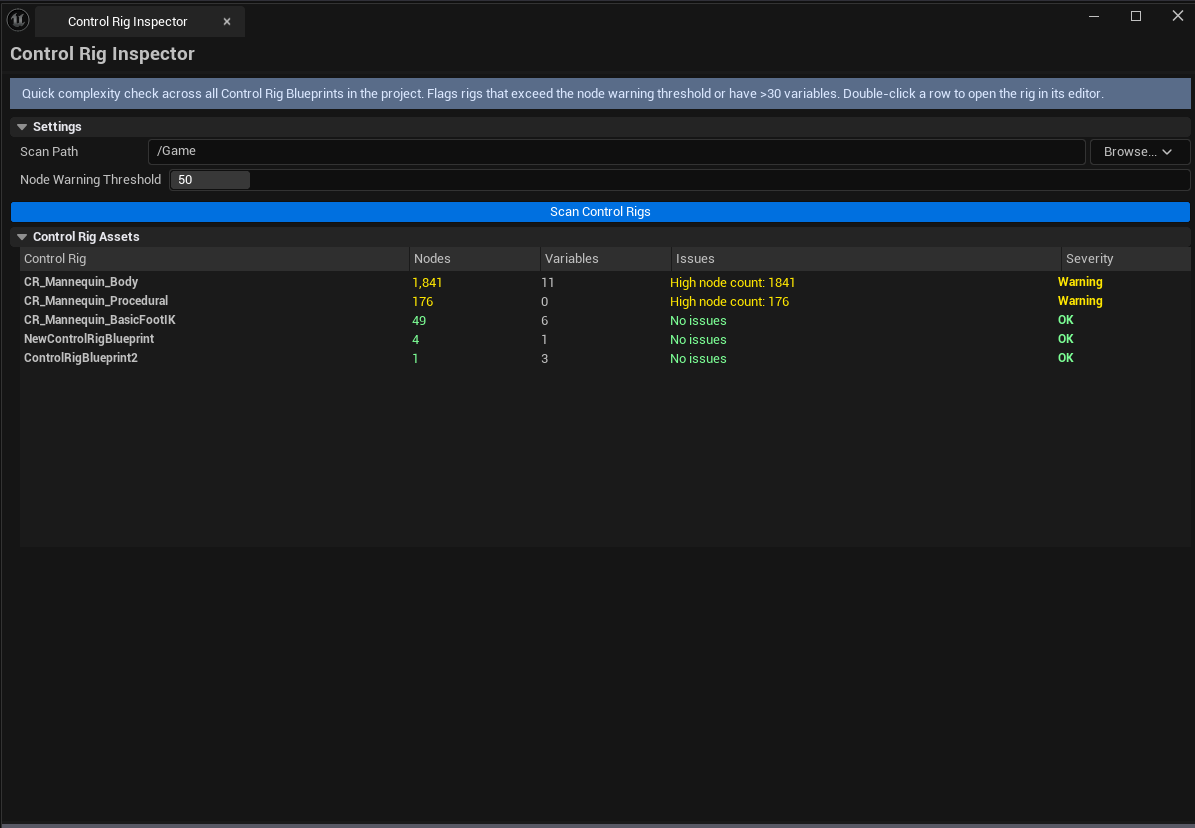
| Results list | Per-rig row: name, total node count, variable count, severity, issue summary |
Severity coding
Section titled “Severity coding”| Severity | Meaning |
|---|---|
| OK | Node and variable counts are within normal ranges |
| Warning | Node count exceeds threshold, or variable count is suspiciously high |
| Critical | Severe complexity — usually a rig that needs to be split or refactored |
Workflow
Section titled “Workflow”Step 1 — Run the scan
Section titled “Step 1 — Run the scan”Pick a scan path (default /Game), set the Node Warning Threshold to your project’s standard (50 is conservative; 100 is generous), click Scan.
Step 2 — Walk Critical first
Section titled “Step 2 — Walk Critical first”The Critical-severity rigs are typically the highest-leverage optimization targets — refactoring one big rig into two smaller ones often gives more performance back than tuning ten small rigs.
Step 3 — Drill in with Dependency Navigator
Section titled “Step 3 — Drill in with Dependency Navigator”For any rig you want to investigate further, switch to Control Rig Dependency Navigator for the deeper analysis (variable cross-references, graph depth, backward-solve usage).
Settings reference
Section titled “Settings reference”| Field | What it does | Default |
|---|---|---|
| Scan Path | Folder to recursively scan | /Game |
| Node Warning Threshold | Threshold for Warning severity | 50 |
Settings are persisted to
[Project]/Saved/EQLabs/Settings/ControlRigInspector.json.
Output
Section titled “Output”- In-panel list — cleared on each rescan
- No edits — read-only against the source rigs
Tips & gotchas
Section titled “Tips & gotchas”- Inspection is reflection-only — no Control Rig module dependency. Counts are accurate but the inspector doesn’t render the graph itself; for that, open the rig in UE’s Control Rig editor.
- High variable count on a rig is sometimes legitimate — Animation BPs that drive a complex MetaHuman face rig will have a lot of variables for valid reasons.
- Node count is the better signal for performance — a rig with 200+ nodes will tick noticeably slower than one with 30, regardless of variable count.
- Single-click pings the rig asset; double-click opens the Control Rig editor.
Related tools
Section titled “Related tools”- Control Rig Dependency Navigator — deeper per-rig analysis (graph depth, variable cross-refs, backward-solve)
- Skeleton Inspector & Rig Shortcuts — analyze the skeleton this rig is built on, and shortcut to the Control Rig Blueprint factory dialog
Opens our feedback form in a new tab with the tool name pre-filled.