
No. 0271 TE TechEQLabs Pro
Replication Debugger
Module: Tech · Category: Debugging · Tool ID:
ReplicationDebugger
Audits the active level for replication setup issues: actors with bReplicates=true but missing replicated properties; replicate-movement on actors without root components; components not set to replicate when their parent does; high net update frequency warnings; net relevancy distance; dormancy mode; bandwidth estimation per actor.
When to use it
Section titled “When to use it”- Multiplayer pre-shipping audit: finding actors with broken or suspect replication setup
- Bandwidth budget review: per-actor estimated kbps
- Debugging “this actor doesn’t replicate” reports: usually a missing flag
What it isn’t for
Section titled “What it isn’t for”- Don’t expect runtime traffic capture. This is asset/level-side analysis.
- Don’t use this for non-multiplayer projects. There’s nothing to debug.
Opening the tool
Section titled “Opening the tool”- Open the EQLabs Hub and search for Replication (or browse to Tech → Debugging).
- Click the tool card.
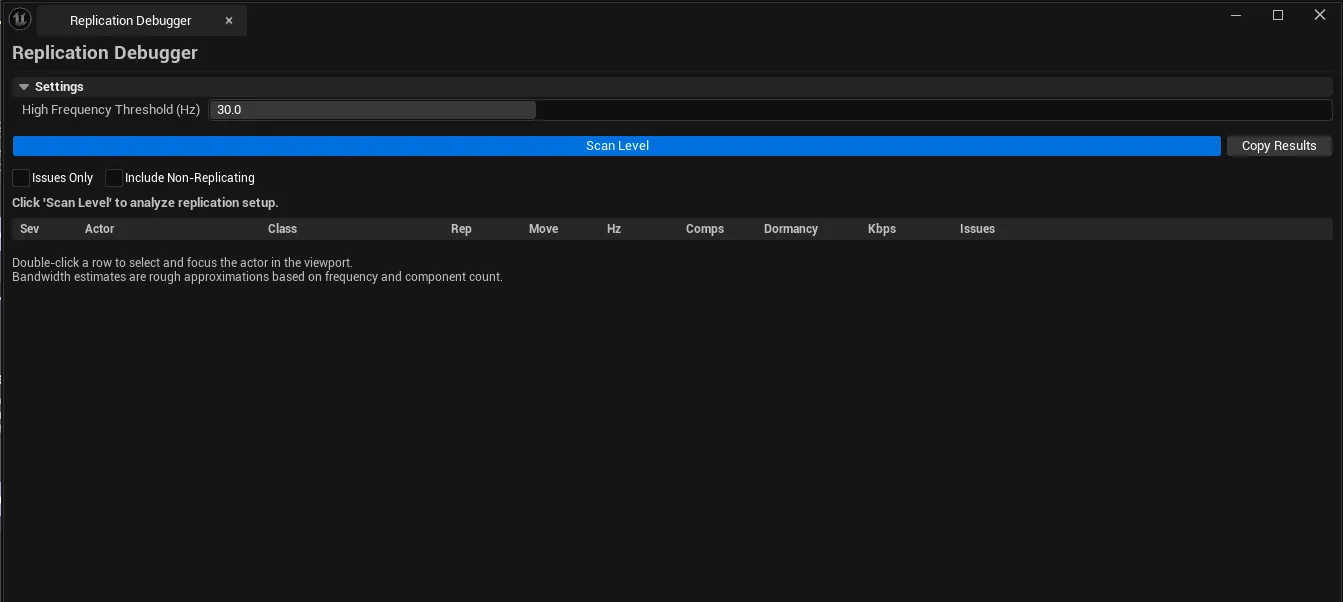
- Click Scan Level.
Interface tour
Section titled “Interface tour”| Section | What it does | Default |
|---|---|---|
| Scan Level | Walks every actor in the active level | |
| High Frequency Threshold | NetUpdateFrequency above this is flagged | 30.0 |
| Show Issues Only | Hide healthy actors | |
| Include Non-Replicating | Include actors with bReplicates=false | |
| Copy Results | Plain-text dump | |
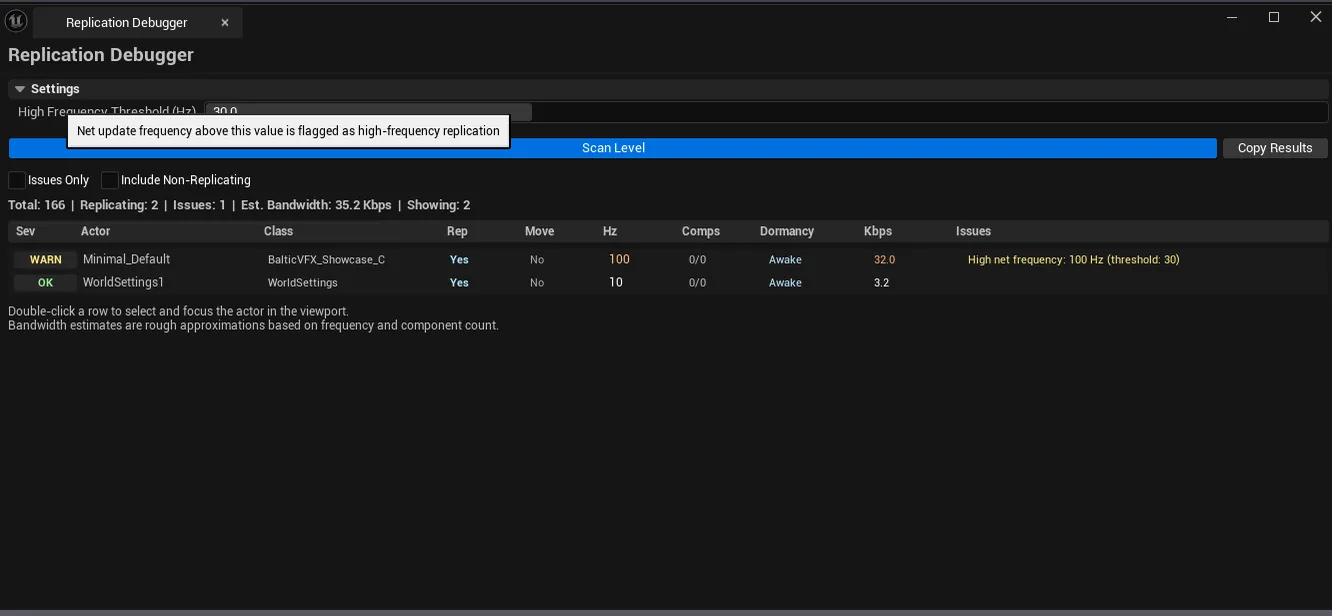
| Stats | Total / replicating / issue count / total bandwidth | |
| Actors list | Per-actor row: name, class, replicates flag, replicate movement, NetUpdateFrequency, NetCullDistance, dormancy, replicated component count, total components, est. bandwidth kbps, severity, issues |
Severity coding
Section titled “Severity coding”| Severity | Meaning |
|---|---|
| OK | Properly configured |
| Info | Minor inefficiency |
| Warning | Likely issue (high frequency, suspect setup) |
| Error | Broken (replicates but no replicated properties, etc.) |
Workflow
Section titled “Workflow”- Open the level.
- Click Scan Level.
- Toggle Show Issues Only to focus on actionable rows.
- Walk Error severities first.
- Sort by Est. Bandwidth descending — top entries are highest-impact.
- Single-click rows to select the actor in the viewport.
Settings reference
Section titled “Settings reference”| Field | Default |
|---|---|
| High Frequency Threshold | 30.0 |
| Show Issues Only | false |
| Include Non-Replicating | false |
Settings file:
[Project]/Saved/EQLabs/Settings/ReplicationDebugger.json
Output
Section titled “Output”- In-panel actors list
- Clipboard. Copy Results.
- No level edits. Read-only audit.
Tips and gotchas
Section titled “Tips and gotchas”- Bandwidth is an estimate. Based on
NetUpdateFrequency × replicated property size. Real traffic is affected by relevancy + dormancy + delta compression. - High NetUpdateFrequency is rarely needed. Typical actors should be
10–30 Hz.60+ Hzis usually a bug or a hero actor. - Dormancy modes can save significant bandwidth. Review actors with
Awakedormancy that should probably beInitialorDormantAll.
Related tools
Section titled “Related tools”- Project Doctor Suite. Broader project audit.
- Subsystem Viewer. For replication-related subsystems.
Report an issue with this tool
Opens our feedback form in a new tab with the tool name pre-filled.