
No. 0181 TE TechEQLabs Pro
Material Profiler
Module: Tech · Category: QA · Tool ID:
MaterialProfiler
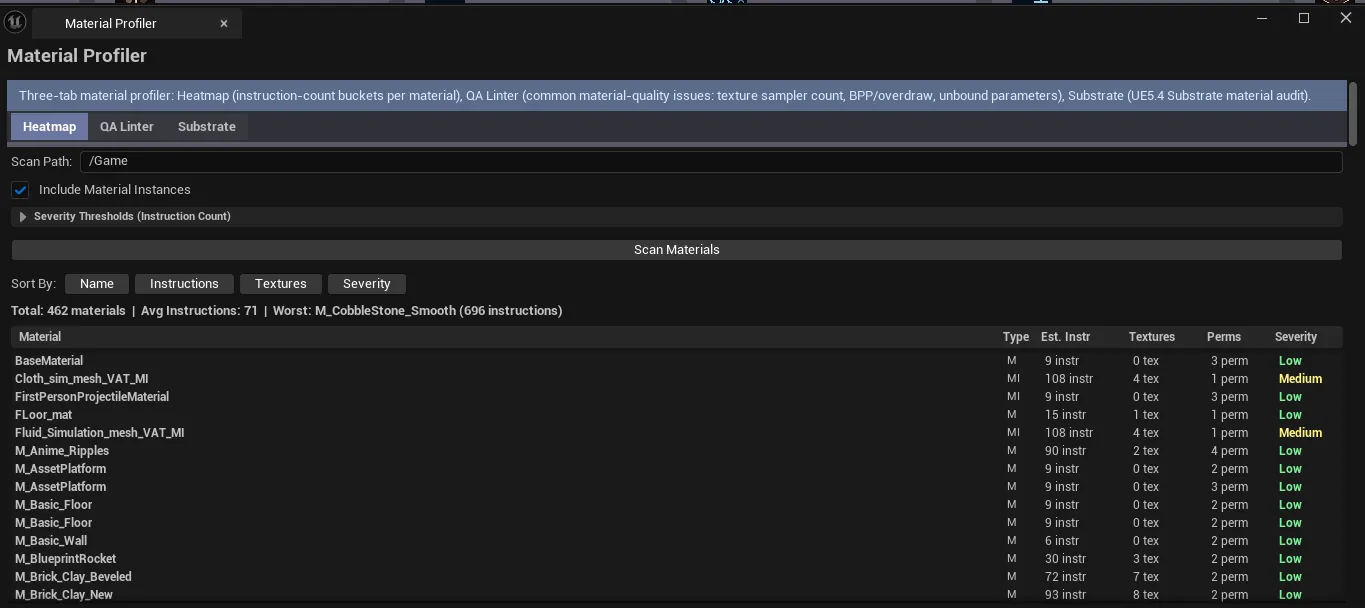
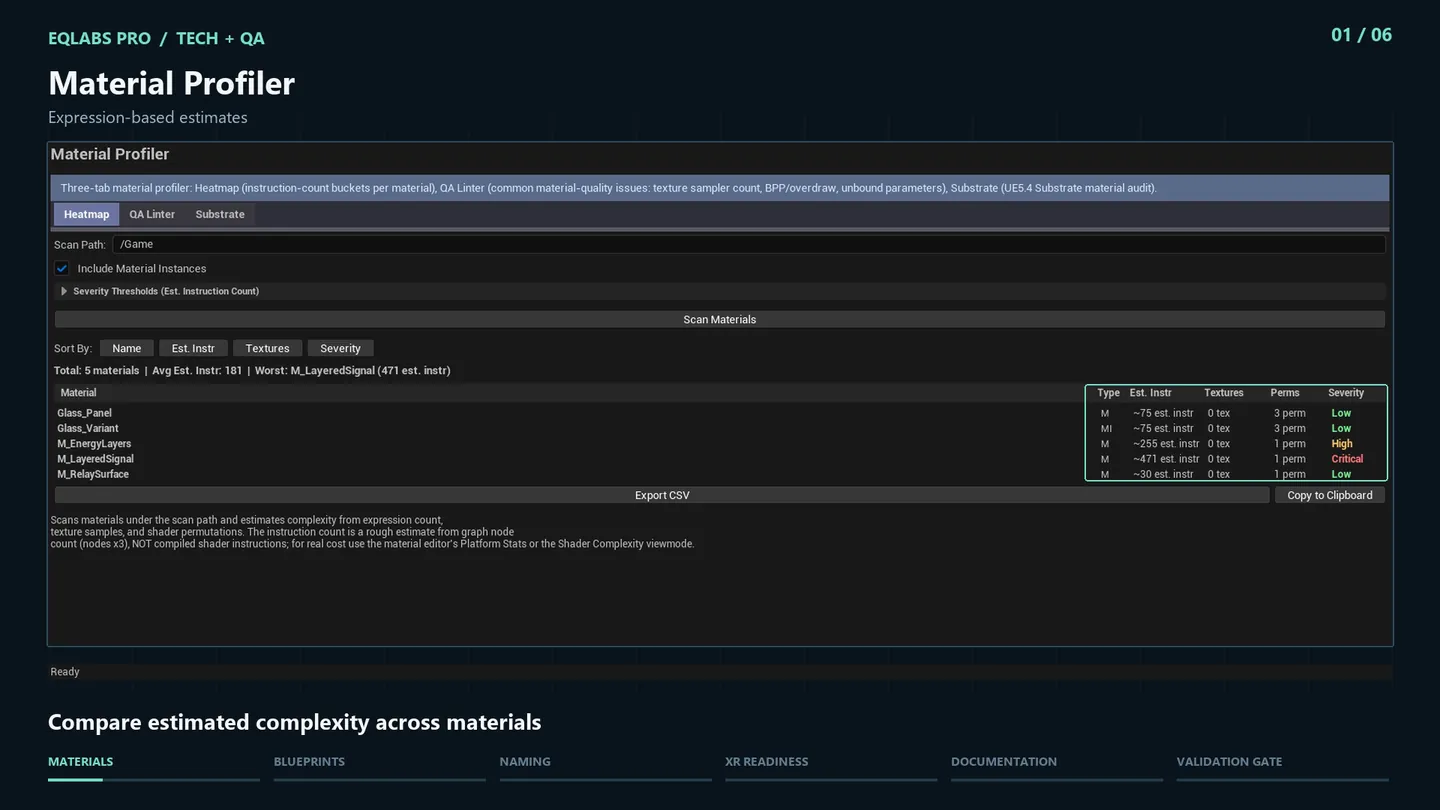
Three-tab material analysis suite. Heatmap classifies every material visually by complexity. QA Linter runs project-wide quality checks (BPP usage, sampler count, instruction limits, naming). Substrate reports Substrate-shading-model compatibility for projects using UE5’s Substrate path.
When to use it
Section titled “When to use it”- Material performance audit: finding the most expensive materials
- QA pass: confirming materials follow project conventions (BPP, sampler limits, naming)
- Substrate migration: finding compatible / incompatible materials
What it isn’t for
Section titled “What it isn’t for”- Don’t expect this to fix materials. Surfaces issues; fixes happen per-material in the Material editor.
Opening the tool
Section titled “Opening the tool”- Open the EQLabs Hub and search for Material Profiler (or browse to Tech → QA).
- Click the tool card.
- Use the tab bar: Heatmap / QA Linter / Substrate.
Tab 1: Material Complexity Heatmap
Section titled “Tab 1: Material Complexity Heatmap”Visual complexity classification — instruction count, sampler count, texture lookups summed into a complexity score with color-coded severity.
Tab 2: Material QA Linter
Section titled “Tab 2: Material QA Linter”Project-wide audit covering:
- BPP (Bytes Per Pixel) usage limits
- Sampler count exceeding platform limits
- Instruction count thresholds
- Naming convention compliance
- Common authoring mistakes

Tab 3: Substrate Analyzer
Section titled “Tab 3: Substrate Analyzer”Substrate shading-model audit (UE 5.4+).
Output
Section titled “Output”- In-panel results per tab.
- Click-to-navigate. Single-click pings asset, double-click opens Material editor.
- No edits. Read-only.
Tips and gotchas
Section titled “Tips and gotchas”- BPP limits are platform-dependent. Mobile/Quest are tighter than Desktop/Console.
- Substrate-incompatible materials need migration. Won’t render correctly in Substrate-mode.
Related tools
Section titled “Related tools”- Shader Diagnostics Suite — shader-level analysis
- Material Layer Studio — parent-chain debugging
Report an issue with this tool
Opens our feedback form in a new tab with the tool name pre-filled.